
Versteht die Aufgabe
Der Agent verbindet Ihre Vorgaben mit den Quellen, statt nur eine Ein-Klick-Konvertierung auszuführen.
Fügen Sie die passenden Unterlagen hinzu (eine Excel-, CSV- oder TSV-Datei) und beschreiben Sie Ihr Ziel. Sie erhalten einen klaren Analysebericht, das Sie prüfen und weiterbearbeiten können.
Stellen Sie eine Excel-, CSV- oder TSV-Datei und die für diese Aufgabe wichtigen Angaben bereit.
Der Agent prüft die Quellen, folgt Ihren Vorgaben und erstellt einen klaren Analysebericht.
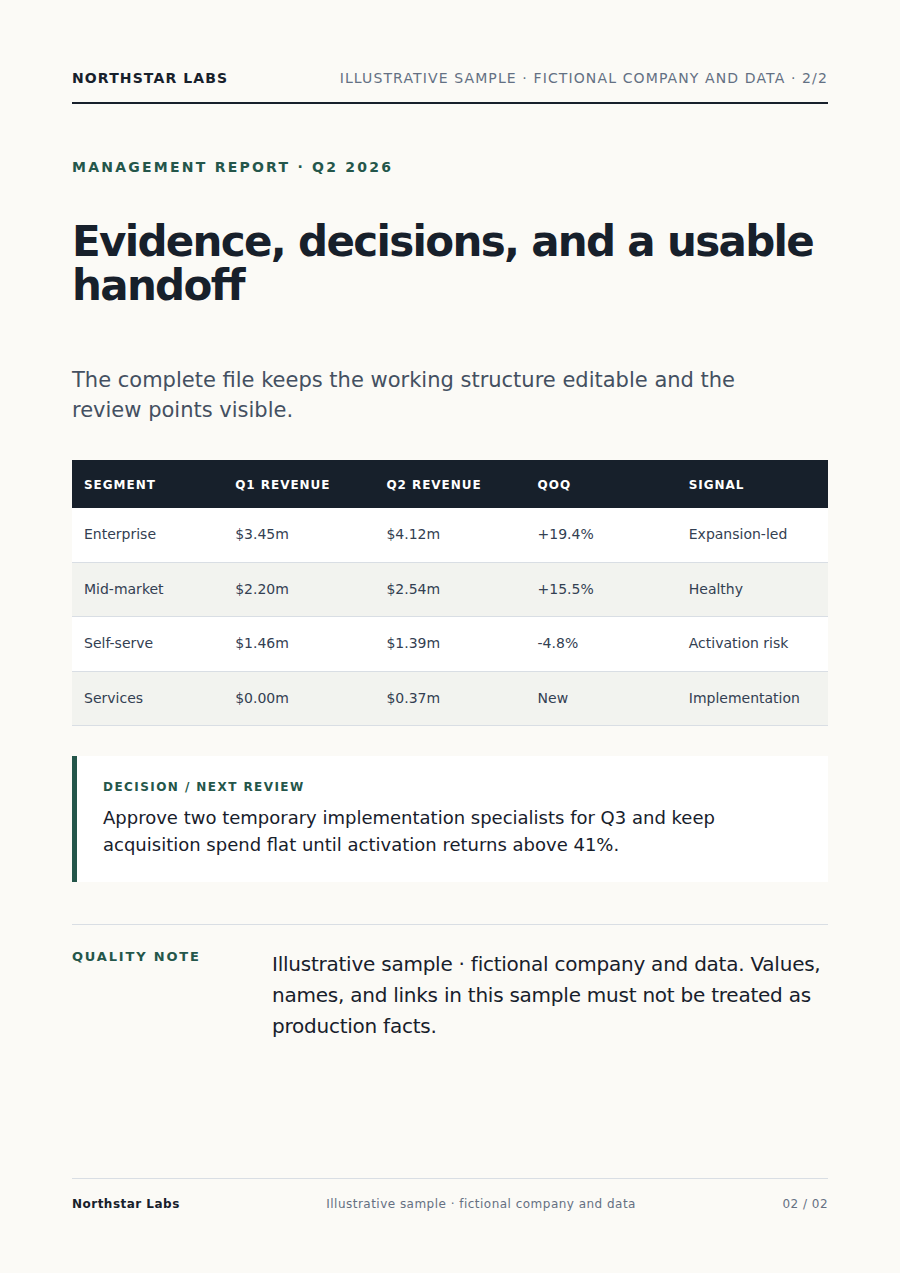
Prüfen Sie das Ergebnis, verlangen Sie Änderungen im selben Gespräch und laden Sie die finale Fassung herunter.
Öffnen Sie die vollständige Datei oder sehen Sie sich unten die wichtigsten Seiten an.
Vollständige Datei öffnen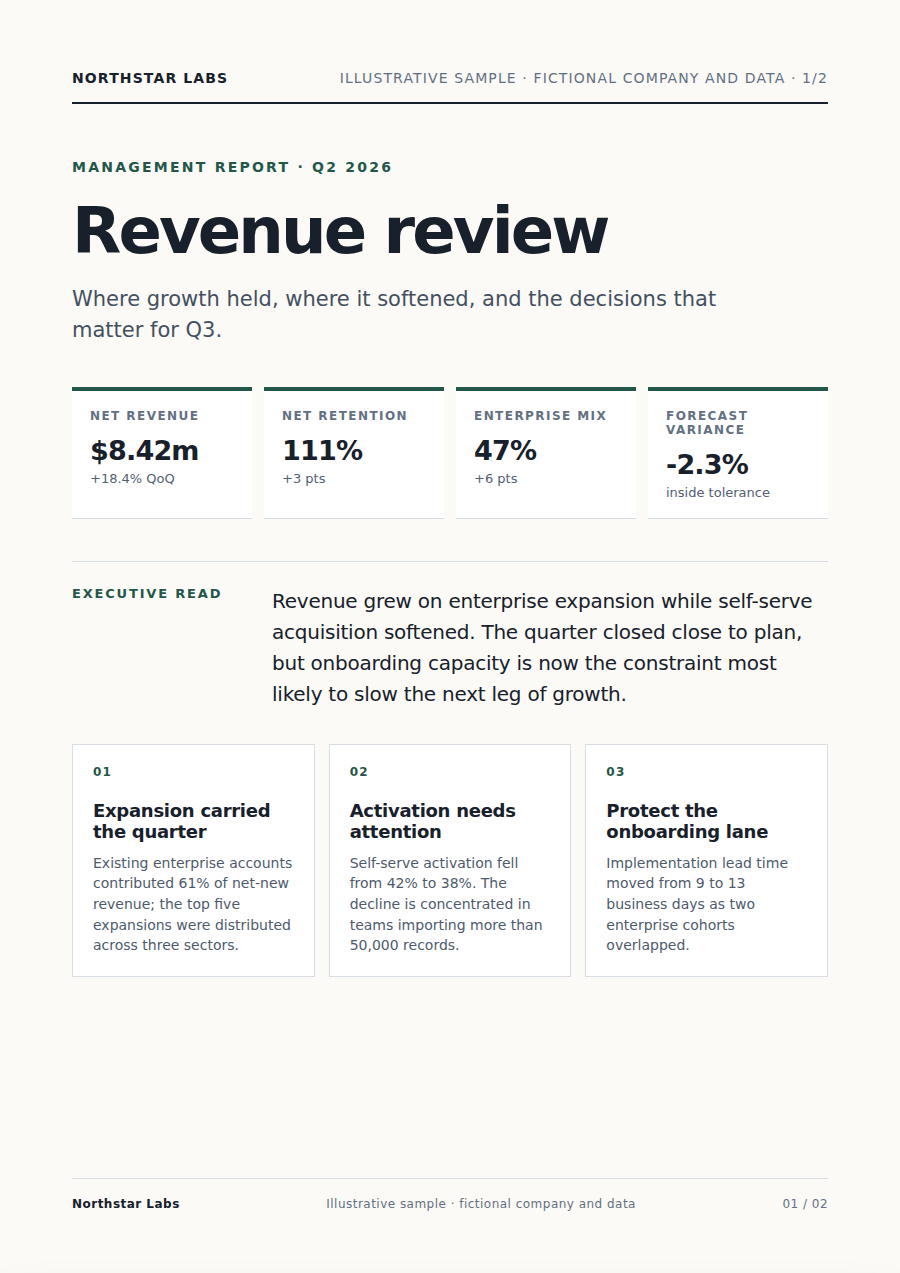
Der Agent verbindet Ihre Vorgaben mit den Quellen, statt nur eine Ein-Klick-Konvertierung auszuführen.
Wichtige Aussagen bleiben mit Ihrem Material verknüpft; Unsicherheiten werden zur Prüfung markiert.
Sie erhalten einen klaren Analysebericht, die Sie prüfen, herunterladen und weiter verbessern können.
Beginnen Sie mit eine Excel-, CSV- oder TSV-Datei und ergänzen Sie Zielgruppe, Ziel, Vorgaben und gewünschtes Format.
Er liest die Quellen, plant die Arbeit, nutzt passende Werkzeuge und erstellt einen klaren Analysebericht zur Prüfung.
Ja. Prüfen Sie das Ergebnis und lassen Sie sich einzelne Punkte erklären oder ändern.
Ja. Passen Sie im selben Gespräch Schwerpunkt, Formulierung, Umfang oder Format weiter an.
Arbeiten Sie mit demselben Material weiter, ohne Dateien zwischen Produkten zu verschieben.
Für Datenbereinigung: eine CSV-, TSV-, Tabellen- oder JSON-Datei hinzufügen. Der Vecbase-Agent erstellt eine bereinigte Tabelle mit Änderungsprotokoll zum Prüfen und Bearbeiten.
Für Finanzabschlussbericht: Finanztabellen oder Systemexporte hinzufügen. Der Vecbase-Agent erstellt einen abstimmbaren Finanzbericht zum Prüfen und Bearbeiten.
Für Präsentationserstellung: eine Gliederung, ein Dokument oder Ausgangsnotizen hinzufügen. Der Vecbase-Agent erstellt eine bearbeitbare Präsentation zum Prüfen und Bearbeiten.
Vecbase
Fügen Sie für Datenanalyse eine Excel-, CSV- oder TSV-Datei hinzu, nennen Sie die wichtigsten Anforderungen und lassen Sie den Vecbase-KI-Agenten einen klaren Analysebericht erstellen. Anschließend können Sie alles prüfen und weiterbearbeiten.