
파일이 아닌 업무를 이해
단순 변환이 아니라 자료와 요구사항을 함께 이해해 전체 작업을 수행합니다.
필요한 자료(Excel, CSV 또는 TSV 데이터 파일)와 원하는 결과를 알려 주세요. AI 에이전트가 작업을 진행해 검토하고 수정할 수 있는 결과물(검토하기 쉬운 데이터 분석 결과물)을 준비합니다.
Excel, CSV 또는 TSV 데이터 파일과 이 작업에서 중요한 정보를 공유합니다.
Agent가 자료와 요구사항을 이해하고 검토하기 쉬운 데이터 분석 결과물을 준비합니다.
결과물을 확인하고 같은 대화에서 수정한 뒤 최종 파일을 내려받습니다.
단순 변환이 아니라 자료와 요구사항을 함께 이해해 전체 작업을 수행합니다.
중요한 내용은 제공된 자료와 연결하고 불확실한 부분은 검토할 수 있게 표시합니다.
검토하고 내려받고 계속 개선할 수 있는 검토하기 쉬운 데이터 분석 결과물을 받습니다.
Excel, CSV 또는 TSV 데이터 파일과 함께 대상, 목표, 제약 조건, 원하는 형식을 알려 주세요.
자료를 읽고 작업을 계획한 뒤 적합한 도구를 사용해 검토하기 쉬운 데이터 분석 결과물을 만듭니다.
네. 사용하기 전에 결과물을 검토하고 설명이나 수정을 요청할 수 있습니다.
네. 같은 대화에서 초점, 문구, 범위, 형식을 계속 조정할 수 있습니다.
같은 자료를 여러 제품으로 옮기지 않고 다음 작업을 이어갈 수 있습니다.
데이터 정리: 필요한 자료(CSV, TSV, 스프레드시트 또는 JSON 파일)를 추가하면 Vecbase Agent가 작업합니다. 결과는 변경 기록이 포함된 정리된 데이터 결과물이며, 근거를 확인하고 계속 수정할 수 있습니다.
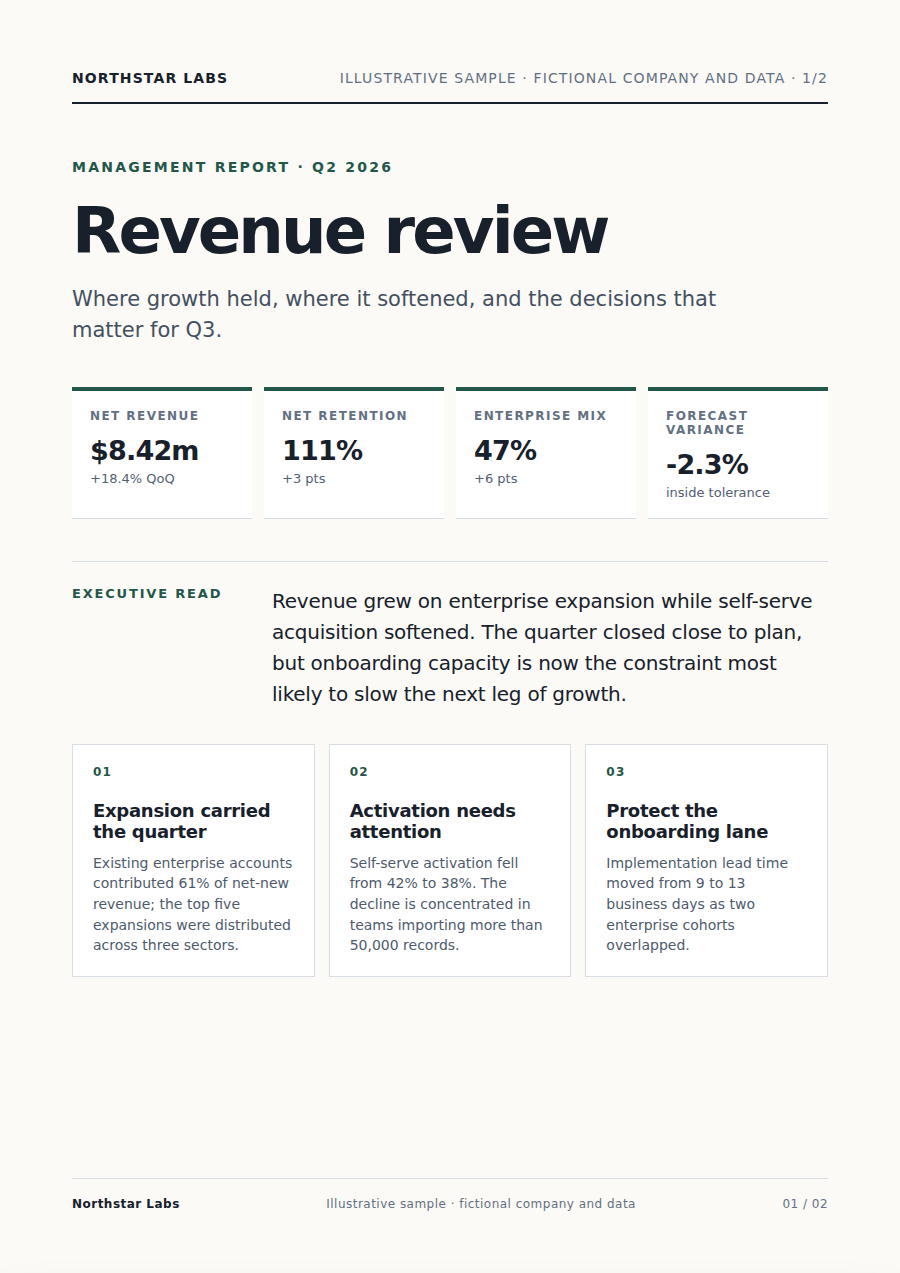
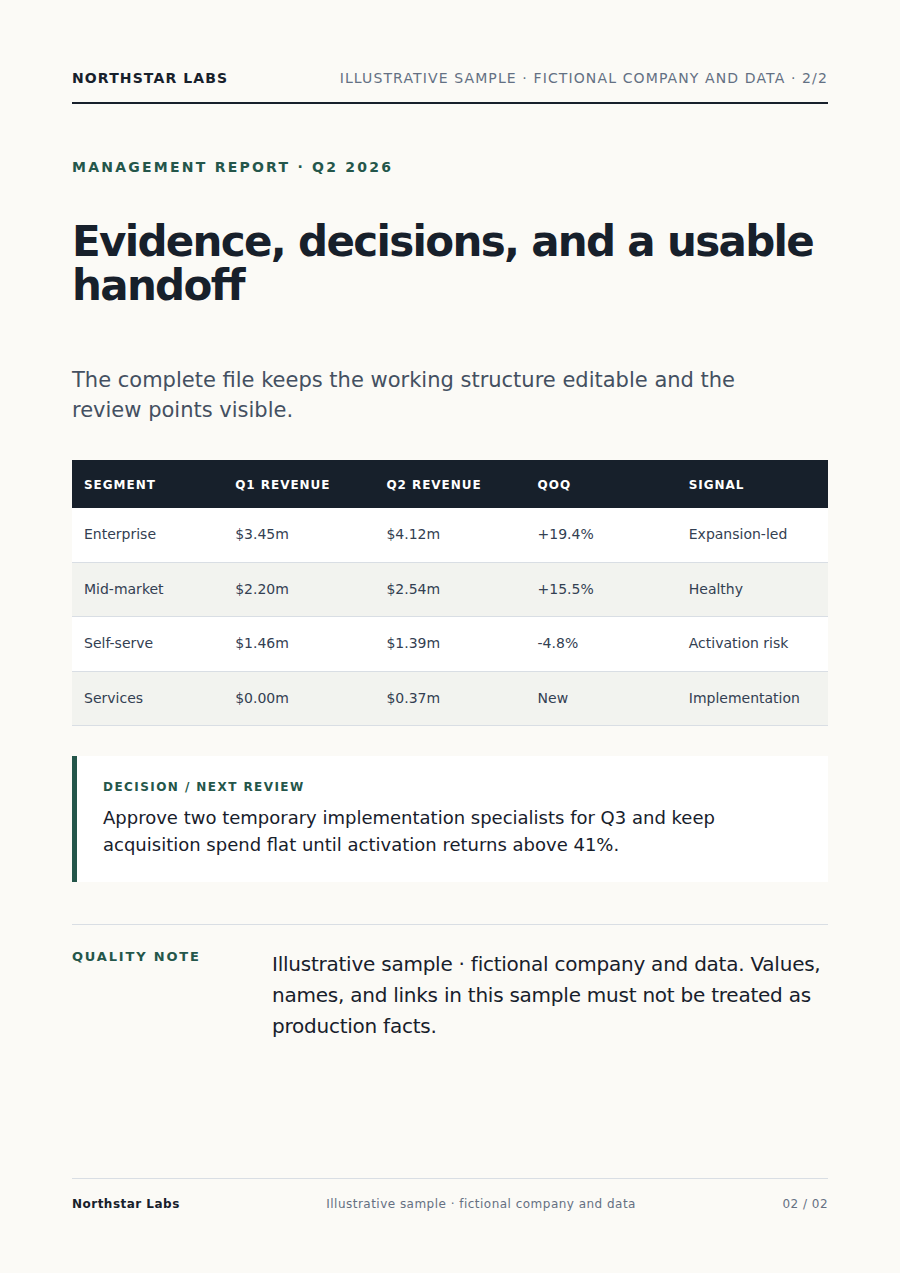
재무 마감 보고: 필요한 자료(재무 스프레드시트 또는 내보낸 데이터 파일)를 추가하면 Vecbase Agent가 작업합니다. 결과는 대사 가능한 재무 보고서 결과물이며, 근거를 확인하고 계속 수정할 수 있습니다.
프레젠테이션 제작: 필요한 자료(개요, 문서 또는 원본 메모 파일)를 추가하면 Vecbase Agent가 작업합니다. 결과는 편집 가능한 프레젠테이션 결과물이며, 근거를 확인하고 계속 수정할 수 있습니다.